1
2
3
4
5
6
7
8
9
10
11
12
13
14
15
16
17
18
19
20
21
22
23
24
25
26
27
28
29
30
31
32
33
34
35
36
37
38
39
40
41
42
43
44
45
46
47
48
49
50
51
52
53
54
55
56
57
58
59
60
61
62
63
| import numpy as np
import matplotlib.pyplot as plt
def CIE_RGB():
rgb = np.zeros([1000,1000,3])
r = np.arange(0,1,0.001)
r,g = np.meshgrid(r,r)
rgb[:,:,0] = r
rgb[:,:,1] = g
rgb[:,:,2] = 1-r-g
over = rgb[:,:,2]<0
rgb[over,:]=[1,1,1]
maxVal = np.max(rgb,2)
for i in [0,1,2]:
rgb[:,:,i] /= maxVal
ax = plt.gca()
ax.imshow(rgb)
ax.invert_yaxis()
plt.xticks(range(0,1001,200),['0','0.2','0.4','0.6','0.8','1'])
plt.yticks(range(0,1001,200),['0','0.2','0.4','0.6','0.8','1'])
plt.show()
def getRGB(dWave,maxPix=1,gamma=1):
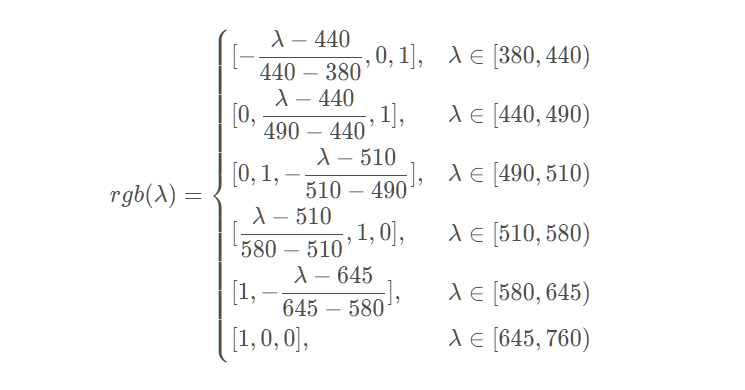
waveArea = [380,440,490,510,580,645,780]
minusWave = [0,440,440,510,510,645,780]
deltWave = [1,60,50,20,70,65,35]
for p in range(len(waveArea)):
if dWave<waveArea[p]:
break
pVar = abs(minusWave[p]-dWave)/deltWave[p]
rgbs = [[0,0,0],[pVar,0,1],[0,pVar,1],[0,1,pVar],
[pVar,1,0],[1,pVar,0],[1,0,0],[0,0,0]]
if (dWave>=380) & (dWave<420):
alpha = 0.3+0.7*(dWave-380)/(420-380)
elif (dWave>=420) & (dWave<701):
alpha = 1.0
elif (dWave>=701) & (dWave<780):
alpha = 0.3+0.7*(780-dWave)/(780-700)
else:
alpha = 0
return [maxPix*(c*alpha)**gamma for c in rgbs[p]]
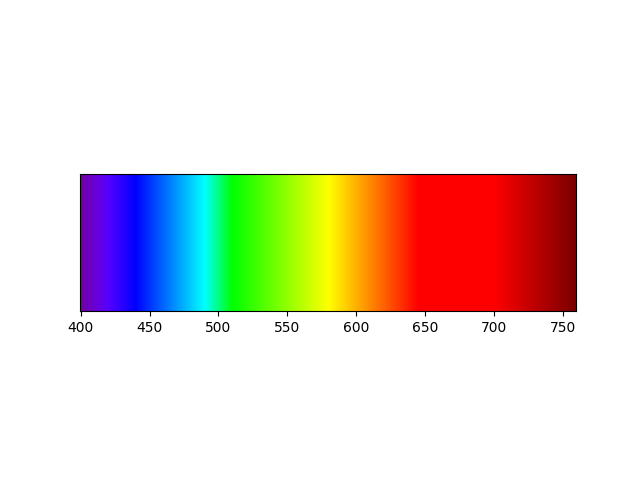
def drawSpec():
pic = np.zeros([100,360,3])
rgb = [getRGB(d) for d in range(400,760)]
pic = pic+rgb
plt.imshow(pic)
plt.yticks([])
plt.xticks(range(0,360,50),['400','450','500','550','600','650','700','750'])
plt.show()
drawSpec()
|